Lederbergia galactosidilyticus
Taxonomy: cellular organisms; Bacteria; Terrabacteria group; Firmicutes; Bacilli; Bacillales; Bacillaceae; Lederbergia
Average proteome isoelectric point is 6.3
Get precalculated fractions of proteins
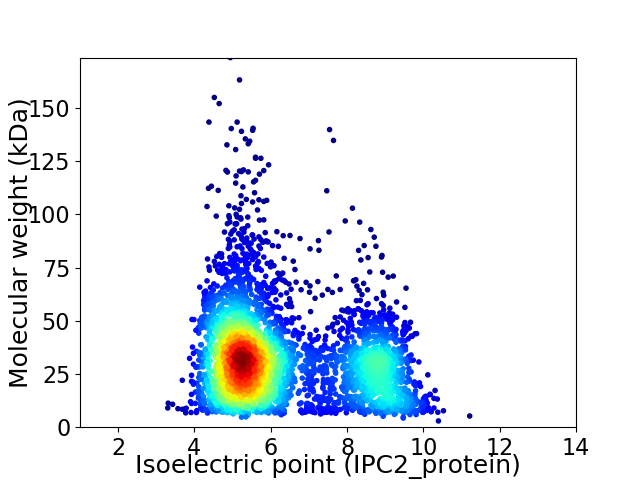
Virtual 2D-PAGE plot for 4048 proteins (isoelectric point calculated using IPC2_protein)
Get csv file with sequences according to given criteria:
* You can choose from 21 different methods for calculating isoelectric point
Summary statistics related to proteome-wise predictions


Protein with the lowest isoelectric point:
>tr|A0A0Q9XZZ1|A0A0Q9XZZ1_9BACI Uncharacterized protein OS=Lederbergia galactosidilyticus OX=217031 GN=ABB05_18285 PE=4 SV=1
MM1 pKa = 6.82VQVKK5 pKa = 10.32LFDD8 pKa = 4.9CDD10 pKa = 3.85HH11 pKa = 6.17EE12 pKa = 4.44QDD14 pKa = 4.98LEE16 pKa = 4.3EE17 pKa = 4.45EE18 pKa = 4.22MNEE21 pKa = 3.9FLEE24 pKa = 4.61QISPRR29 pKa = 11.84DD30 pKa = 3.65VVDD33 pKa = 3.52IKK35 pKa = 11.66YY36 pKa = 10.38NVALIGDD43 pKa = 4.08ASGEE47 pKa = 4.16QVFCFSALIIYY58 pKa = 7.55NTT60 pKa = 3.7
MM1 pKa = 6.82VQVKK5 pKa = 10.32LFDD8 pKa = 4.9CDD10 pKa = 3.85HH11 pKa = 6.17EE12 pKa = 4.44QDD14 pKa = 4.98LEE16 pKa = 4.3EE17 pKa = 4.45EE18 pKa = 4.22MNEE21 pKa = 3.9FLEE24 pKa = 4.61QISPRR29 pKa = 11.84DD30 pKa = 3.65VVDD33 pKa = 3.52IKK35 pKa = 11.66YY36 pKa = 10.38NVALIGDD43 pKa = 4.08ASGEE47 pKa = 4.16QVFCFSALIIYY58 pKa = 7.55NTT60 pKa = 3.7
Molecular weight: 6.91 kDa
Isoelectric point according different methods:
Protein with the highest isoelectric point:
>tr|A0A177ZGE5|A0A177ZGE5_9BACI Uncharacterized protein OS=Lederbergia galactosidilyticus OX=217031 GN=ABB05_22175 PE=4 SV=1
MM1 pKa = 7.44KK2 pKa = 9.59RR3 pKa = 11.84TFQPNKK9 pKa = 8.24RR10 pKa = 11.84KK11 pKa = 9.6RR12 pKa = 11.84SKK14 pKa = 10.24VHH16 pKa = 6.26GFRR19 pKa = 11.84QRR21 pKa = 11.84MSTKK25 pKa = 10.0NGRR28 pKa = 11.84KK29 pKa = 8.83ILAARR34 pKa = 11.84RR35 pKa = 11.84RR36 pKa = 11.84KK37 pKa = 8.84GRR39 pKa = 11.84KK40 pKa = 8.75VLSAA44 pKa = 4.05
MM1 pKa = 7.44KK2 pKa = 9.59RR3 pKa = 11.84TFQPNKK9 pKa = 8.24RR10 pKa = 11.84KK11 pKa = 9.6RR12 pKa = 11.84SKK14 pKa = 10.24VHH16 pKa = 6.26GFRR19 pKa = 11.84QRR21 pKa = 11.84MSTKK25 pKa = 10.0NGRR28 pKa = 11.84KK29 pKa = 8.83ILAARR34 pKa = 11.84RR35 pKa = 11.84RR36 pKa = 11.84KK37 pKa = 8.84GRR39 pKa = 11.84KK40 pKa = 8.75VLSAA44 pKa = 4.05
Molecular weight: 5.27 kDa
Isoelectric point according different methods:
Peptides (in silico digests for buttom-up proteomics)
Below you can find in silico digests of the whole proteome with Trypsin, Chymotrypsin, Trypsin+LysC, LysN, ArgC proteases suitable for different mass spec machines.| Try ESI |
 |
|---|
| ChTry ESI |
|
|---|
| ArgC ESI |
|
|---|
| LysN ESI |
|
|---|
| TryLysC ESI |
|
|---|
| Try MALDI |
|
|---|
| ChTry MALDI |
|
|---|
| ArgC MALDI |
|
|---|
| LysN MALDI |
|
|---|
| TryLysC MALDI |
|
|---|
| Try LTQ |
|
|---|
| ChTry LTQ |
|
|---|
| ArgC LTQ |
|
|---|
| LysN LTQ |
|
|---|
| TryLysC LTQ |
|
|---|
| Try MSlow |
|
|---|
| ChTry MSlow |
|
|---|
| ArgC MSlow |
|
|---|
| LysN MSlow |
|
|---|
| TryLysC MSlow |
|
|---|
| Try MShigh |
|
|---|
| ChTry MShigh |
|
|---|
| ArgC MShigh |
|
|---|
| LysN MShigh |
|
|---|
| TryLysC MShigh |
|
|---|
General Statistics
Number of major isoforms |
Number of additional isoforms |
Number of all proteins |
Number of amino acids |
Min. Seq. Length |
Max. Seq. Length |
Avg. Seq. Length |
Avg. Mol. Weight |
|---|---|---|---|---|---|---|---|
0 |
1205544 |
26 |
1562 |
297.8 |
33.62 |
Amino acid frequency
Ala |
Cys |
Asp |
Glu |
Phe |
Gly |
His |
Ile |
Lys |
Leu |
|---|---|---|---|---|---|---|---|---|---|
6.702 ± 0.035 | 0.684 ± 0.011 |
5.158 ± 0.031 | 7.639 ± 0.05 |
4.729 ± 0.036 | 6.717 ± 0.034 |
2.1 ± 0.018 | 8.195 ± 0.041 |
6.867 ± 0.033 | 9.894 ± 0.041 |
Met |
Asn |
Gln |
Pro |
Arg |
Ser |
Thr |
Val |
Trp |
Tyr |
|---|---|---|---|---|---|---|---|---|---|
2.79 ± 0.019 | 4.387 ± 0.025 |
3.674 ± 0.02 | 4.065 ± 0.024 |
3.919 ± 0.025 | 5.797 ± 0.028 |
5.328 ± 0.023 | 6.51 ± 0.029 |
1.188 ± 0.017 | 3.657 ± 0.022 |
Most of the basic statistics you can see at this page can be downloaded from this CSV file
See this proteome in:

Proteome-pI is available under Creative Commons Attribution-NoDerivs license, for more details see here
| Reference: Kozlowski LP. Proteome-pI 2.0: Proteome Isoelectric Point Database Update. Nucleic Acids Res. 2021, doi: 10.1093/nar/gkab944 | Contact: Lukasz P. Kozlowski |