Kingella negevensis
Taxonomy: cellular organisms; Bacteria; Proteobacteria; Betaproteobacteria; Neisseriales; Neisseriaceae; Kingella
Average proteome isoelectric point is 6.63
Get precalculated fractions of proteins
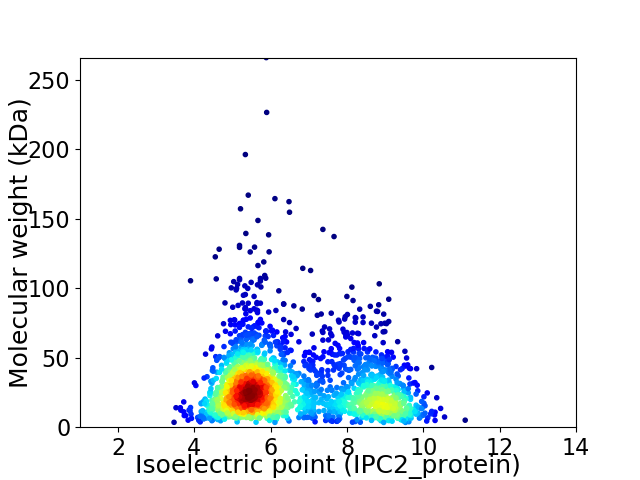
Virtual 2D-PAGE plot for 2100 proteins (isoelectric point calculated using IPC2_protein)
Get csv file with sequences according to given criteria:
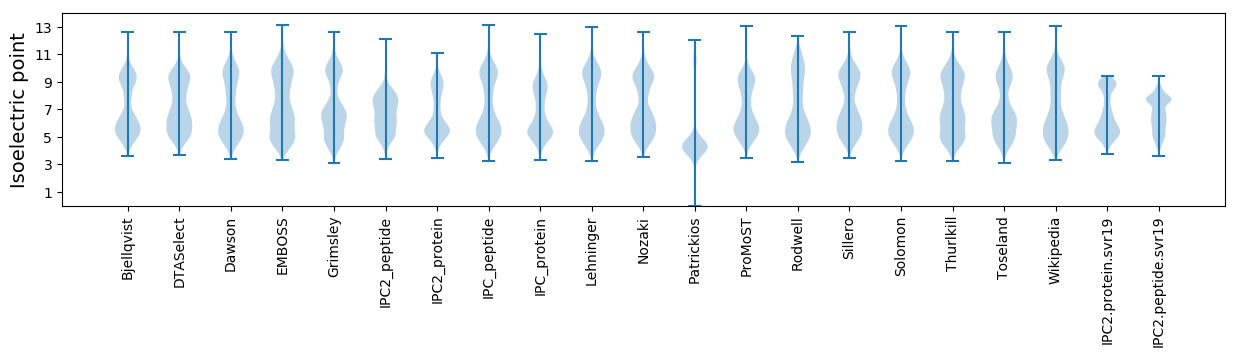
* You can choose from 21 different methods for calculating isoelectric point
Summary statistics related to proteome-wise predictions

Protein with the lowest isoelectric point:
>tr|A0A238HI21|A0A238HI21_9NEIS Isoform of A0A238HG87 ATP synthase subunit c OS=Kingella negevensis OX=1522312 GN=atpE PE=3 SV=1
MM1 pKa = 7.7CFLDD5 pKa = 4.78NGFCTRR11 pKa = 11.84EE12 pKa = 3.63RR13 pKa = 11.84FFDD16 pKa = 3.44EE17 pKa = 4.94RR18 pKa = 11.84EE19 pKa = 4.19CVDD22 pKa = 3.65PNDD25 pKa = 4.26FVAQLGGEE33 pKa = 4.51LSPANAASLLDD44 pKa = 3.6MMNGAEE50 pKa = 4.13ITEE53 pKa = 4.76LLDD56 pKa = 5.03DD57 pKa = 4.77MNAPDD62 pKa = 5.84CGWQYY67 pKa = 11.5LGNFCRR73 pKa = 11.84AII75 pKa = 3.65
MM1 pKa = 7.7CFLDD5 pKa = 4.78NGFCTRR11 pKa = 11.84EE12 pKa = 3.63RR13 pKa = 11.84FFDD16 pKa = 3.44EE17 pKa = 4.94RR18 pKa = 11.84EE19 pKa = 4.19CVDD22 pKa = 3.65PNDD25 pKa = 4.26FVAQLGGEE33 pKa = 4.51LSPANAASLLDD44 pKa = 3.6MMNGAEE50 pKa = 4.13ITEE53 pKa = 4.76LLDD56 pKa = 5.03DD57 pKa = 4.77MNAPDD62 pKa = 5.84CGWQYY67 pKa = 11.5LGNFCRR73 pKa = 11.84AII75 pKa = 3.65
Molecular weight: 8.39 kDa
Isoelectric point according different methods:
Protein with the highest isoelectric point:
>tr|A0A238TG83|A0A238TG83_9NEIS Isoform of A0A238HFG4 Uncharacterized protein OS=Kingella negevensis OX=1522312 GN=KEBURONENSIS_00691 PE=4 SV=1
MM1 pKa = 7.35KK2 pKa = 9.36RR3 pKa = 11.84TYY5 pKa = 10.14QPSVTKK11 pKa = 10.56RR12 pKa = 11.84KK13 pKa = 7.91RR14 pKa = 11.84THH16 pKa = 5.89GFLVRR21 pKa = 11.84SKK23 pKa = 9.38TRR25 pKa = 11.84GGRR28 pKa = 11.84AVLAARR34 pKa = 11.84RR35 pKa = 11.84AKK37 pKa = 9.87GRR39 pKa = 11.84KK40 pKa = 8.75RR41 pKa = 11.84LAVV44 pKa = 3.41
MM1 pKa = 7.35KK2 pKa = 9.36RR3 pKa = 11.84TYY5 pKa = 10.14QPSVTKK11 pKa = 10.56RR12 pKa = 11.84KK13 pKa = 7.91RR14 pKa = 11.84THH16 pKa = 5.89GFLVRR21 pKa = 11.84SKK23 pKa = 9.38TRR25 pKa = 11.84GGRR28 pKa = 11.84AVLAARR34 pKa = 11.84RR35 pKa = 11.84AKK37 pKa = 9.87GRR39 pKa = 11.84KK40 pKa = 8.75RR41 pKa = 11.84LAVV44 pKa = 3.41
Molecular weight: 5.05 kDa
Isoelectric point according different methods:
Peptides (in silico digests for buttom-up proteomics)
Below you can find in silico digests of the whole proteome with Trypsin, Chymotrypsin, Trypsin+LysC, LysN, ArgC proteases suitable for different mass spec machines.| Try ESI |
 |
|---|
| ChTry ESI |
|
|---|
| ArgC ESI |
|
|---|
| LysN ESI |
|
|---|
| TryLysC ESI |
|
|---|
| Try MALDI |
|
|---|
| ChTry MALDI |
|
|---|
| ArgC MALDI |
|
|---|
| LysN MALDI |
|
|---|
| TryLysC MALDI |
|
|---|
| Try LTQ |
|
|---|
| ChTry LTQ |
|
|---|
| ArgC LTQ |
|
|---|
| LysN LTQ |
|
|---|
| TryLysC LTQ |
|
|---|
| Try MSlow |
|
|---|
| ChTry MSlow |
|
|---|
| ArgC MSlow |
|
|---|
| LysN MSlow |
|
|---|
| TryLysC MSlow |
|
|---|
| Try MShigh |
|
|---|
| ChTry MShigh |
|
|---|
| ArgC MShigh |
|
|---|
| LysN MShigh |
|
|---|
| TryLysC MShigh |
|
|---|
General Statistics
Number of major isoforms |
Number of additional isoforms |
Number of all proteins |
Number of amino acids |
Min. Seq. Length |
Max. Seq. Length |
Avg. Seq. Length |
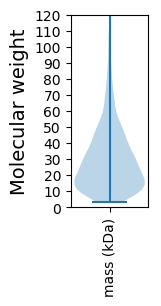
Avg. Mol. Weight |
|---|---|---|---|---|---|---|---|
596964 |
30 |
2511 |
284.3 |
31.56 |
Amino acid frequency
Ala |
Cys |
Asp |
Glu |
Phe |
Gly |
His |
Ile |
Lys |
Leu |
|---|---|---|---|---|---|---|---|---|---|
9.881 ± 0.068 | 1.027 ± 0.02 |
5.027 ± 0.045 | 6.08 ± 0.062 |
4.195 ± 0.04 | 6.747 ± 0.063 |
2.291 ± 0.031 | 5.952 ± 0.053 |
5.669 ± 0.044 | 9.94 ± 0.064 |
Met |
Asn |
Gln |
Pro |
Arg |
Ser |
Thr |
Val |
Trp |
Tyr |
|---|---|---|---|---|---|---|---|---|---|
2.587 ± 0.03 | 4.684 ± 0.05 |
4.02 ± 0.037 | 4.95 ± 0.048 |
4.736 ± 0.049 | 5.682 ± 0.043 |
5.515 ± 0.045 | 6.769 ± 0.049 |
1.271 ± 0.023 | 2.977 ± 0.036 |
Most of the basic statistics you can see at this page can be downloaded from this CSV file
See this proteome in:

Proteome-pI is available under Creative Commons Attribution-NoDerivs license, for more details see here
| Reference: Kozlowski LP. Proteome-pI 2.0: Proteome Isoelectric Point Database Update. Nucleic Acids Res. 2021, doi: 10.1093/nar/gkab944 | Contact: Lukasz P. Kozlowski |